
As costs of living continue to rise nationwide, families are increasingly relying on savings to cover ballooning budgets. But not every household can rely on stored wealth. While one family may comfortably weather a job loss, another just a few blocks away might live paycheck to paycheck and need to take on large amounts of debt.
Local leaders know their residents are struggling, but national statistics rarely capture the nuances of financial health at the neighborhood level. For example, we know that the national median wealth and share of households with $2,000 in emergency savings have each risen since 2019, but both measures have tremendous local variation.
To help local leaders diagnose and prioritize where families in their jurisdictions need support, we updated our Financial Health and Wealth Dashboard. This update includes new data for additional cities, pre- and postpandemic years of data, and three added metrics: utility burden, retirement plan coverage, and earned income tax credit participation. The updated dashboard grounds the severity of the affordability crisis by providing a holistic picture of place-based financial health that demonstrates not just what residents earn or owe, but how they’re doing overall.
Here, we demonstrate how this dashboard can inform local leaders about their residents’ daily finances, resilience to economic shocks, and opportunity to pursue upward mobility. We track these financial health metrics across two cities with innovative wealth-building programs: San Francisco, California, and St. Louis, Missouri.
Daily finances: Rising utility costs are disproportionately hurting low-income households
In 2023, about one in five US households spent more than 10 percent of their income on water, gas, and electric, with electricity costs continuing to rise across the country in the years since. This utility burden can crowd out other essential expenses, like food, transportation, and health care. Because utility rates are the same for all consumers, lower-income households’ utility costs account for a larger share of their budgets than higher-income households.
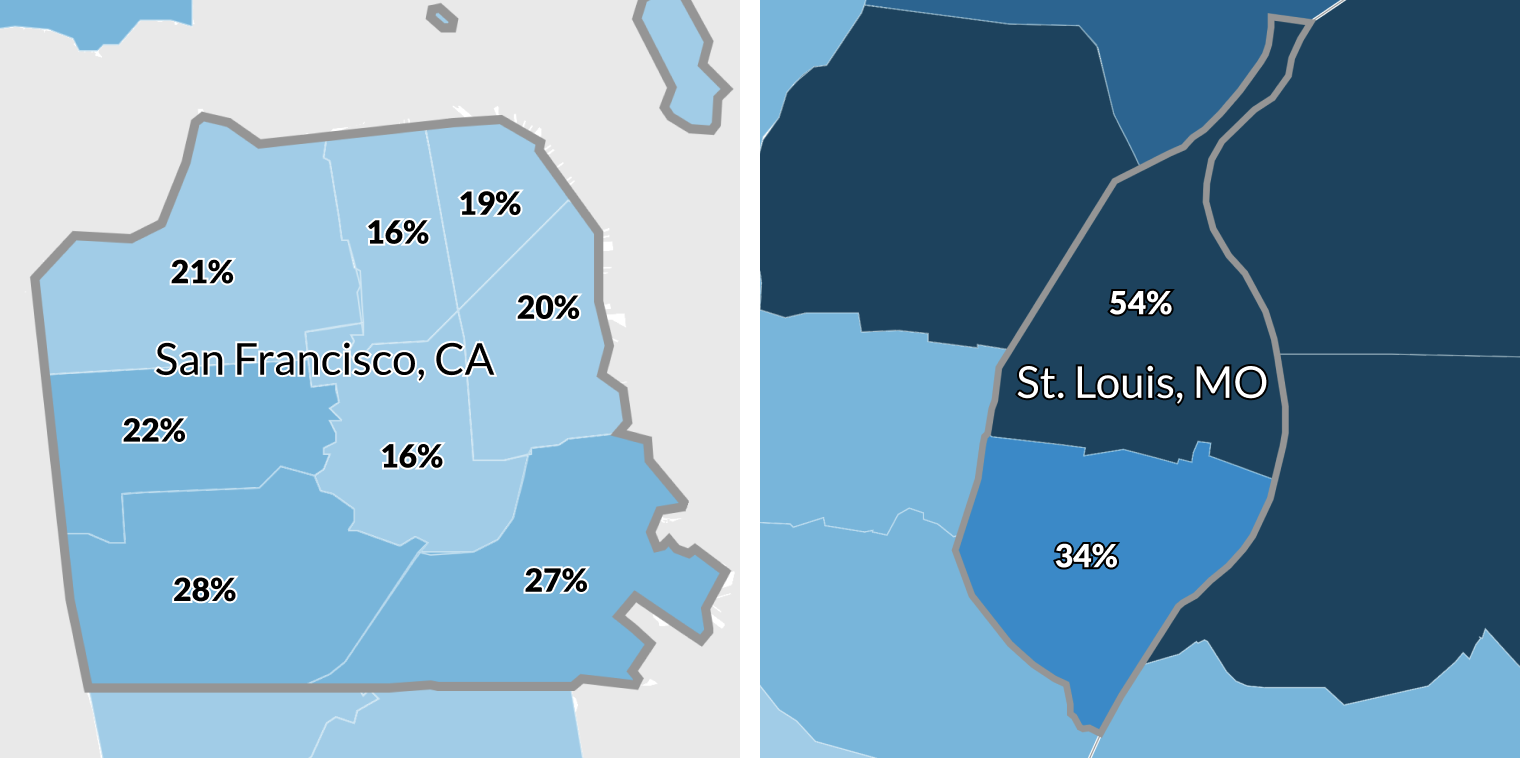
In San Francisco, utility burden has increased significantly since 2019, from 10 percent to 16 percent of households in 2023. Even higher rates of burden exist in the local areas that encompass Ingleside and South Central San Francisco (28 percent) and Bay View and Hunters Point (27 percent). The rate of change has been slower in St. Louis (just a 1 percentage point increase from 2019), but nearly double the number of households are utility burdened (31 percent in 2023) compared with San Francisco. In fact, as many as 54 percent of households in north St. Louis are utility burdened.
Share of utility burdened households in San Francisco and St. Louis, by local area, 2023
City and community leaders in San Francisco and St. Louis can support the most-burdened neighborhoods by targeting resources to manage utility expenses. These leaders can leverage national and state programs like the Weatherization Assistance Program, the California Alternate Rates for Energy Program and Family Electric Rate Assistance Program, and the Missouri Department of Social Services’ Low Income Home Energy Assistance Program to manage their residents’ utility burden despite limited resources. Utility financing tools like rebates, incentives, and on-bill financing can improve access to upstream efficiency interventions that can greatly reduce utility costs for residents.
Resilience: Emergency savings act as a buffer for some but are out of reach for many
Savings can cushion against life’s unexpected shocks: a car repair, a medical bill, a missed paycheck. Without this buffer, small disruptions can spiral into crises.
More than a third of US households didn’t have $2,000 in emergency savings in 2022, though this rate varied nationwide. Knowing where people lack savings can allow city and community leaders to effectively invest in programs that help people move through hard times.
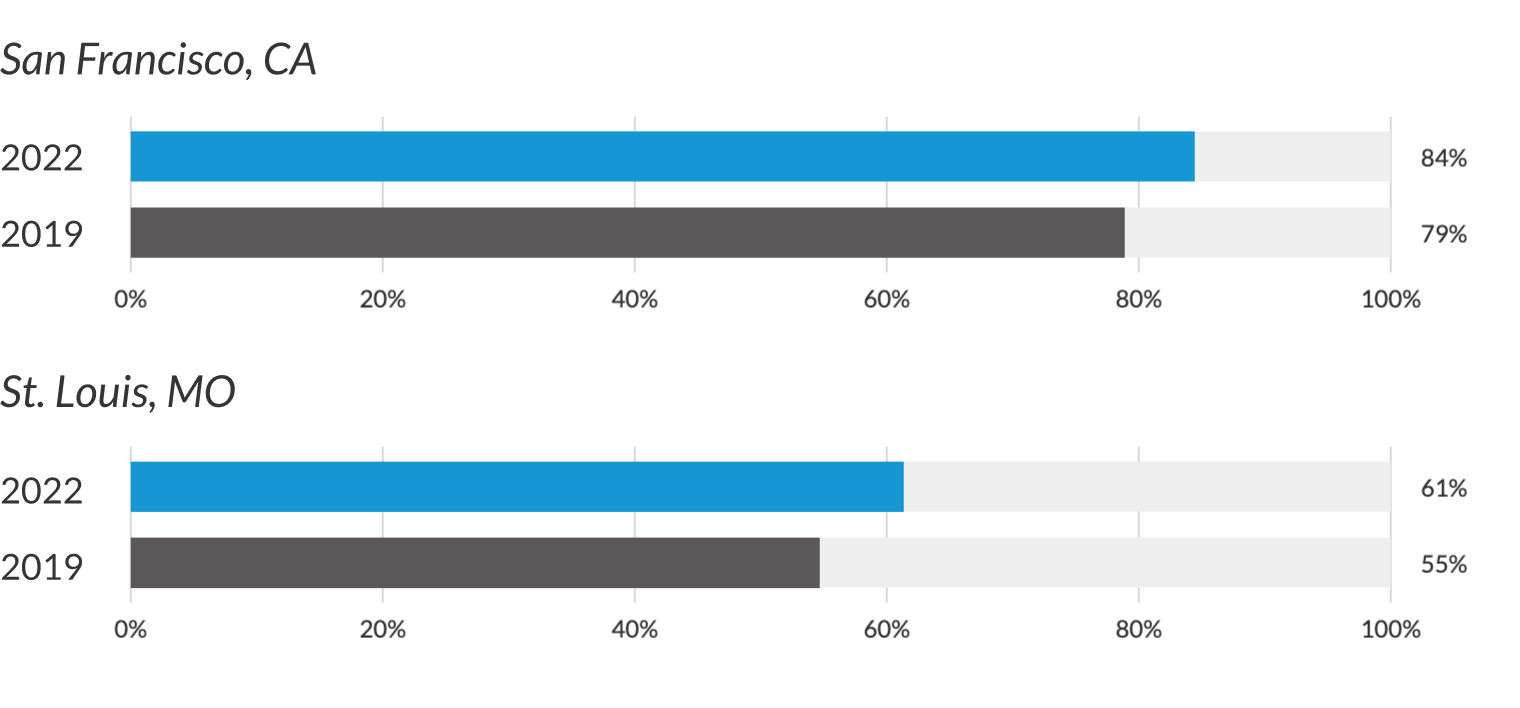
Between 2019 and 2022, San Francisco and St. Louis saw increases in the rates of households with at least $2,000 in emergency savings. In San Francisco, 84 percent of households, including 80 percent of households of color, have this savings cushion. And in St. Louis, 61percent of households have at least $2,000 in emergency savings, including 48 percent of households of color.
Share of households with at least $2,000 in emergency savings (estimated)
Local leaders can incentivize and reward liquid savings through matched savings, sidecar savings, and nonprofit programs, including those targeted at boosting the liquid savings of municipal employees.
Opportunity: Median wealth rose in most places from 2019 to 2022
People need access to credit or capital to own a home or a small business, obtain a college degree, or securely retire. But generally, this kind of upward mobility requires wealth, which varies greatly by location. By mapping wealth data at the neighborhood level, local leaders can design and target strategies that support homeownership, asset building, and economic development.
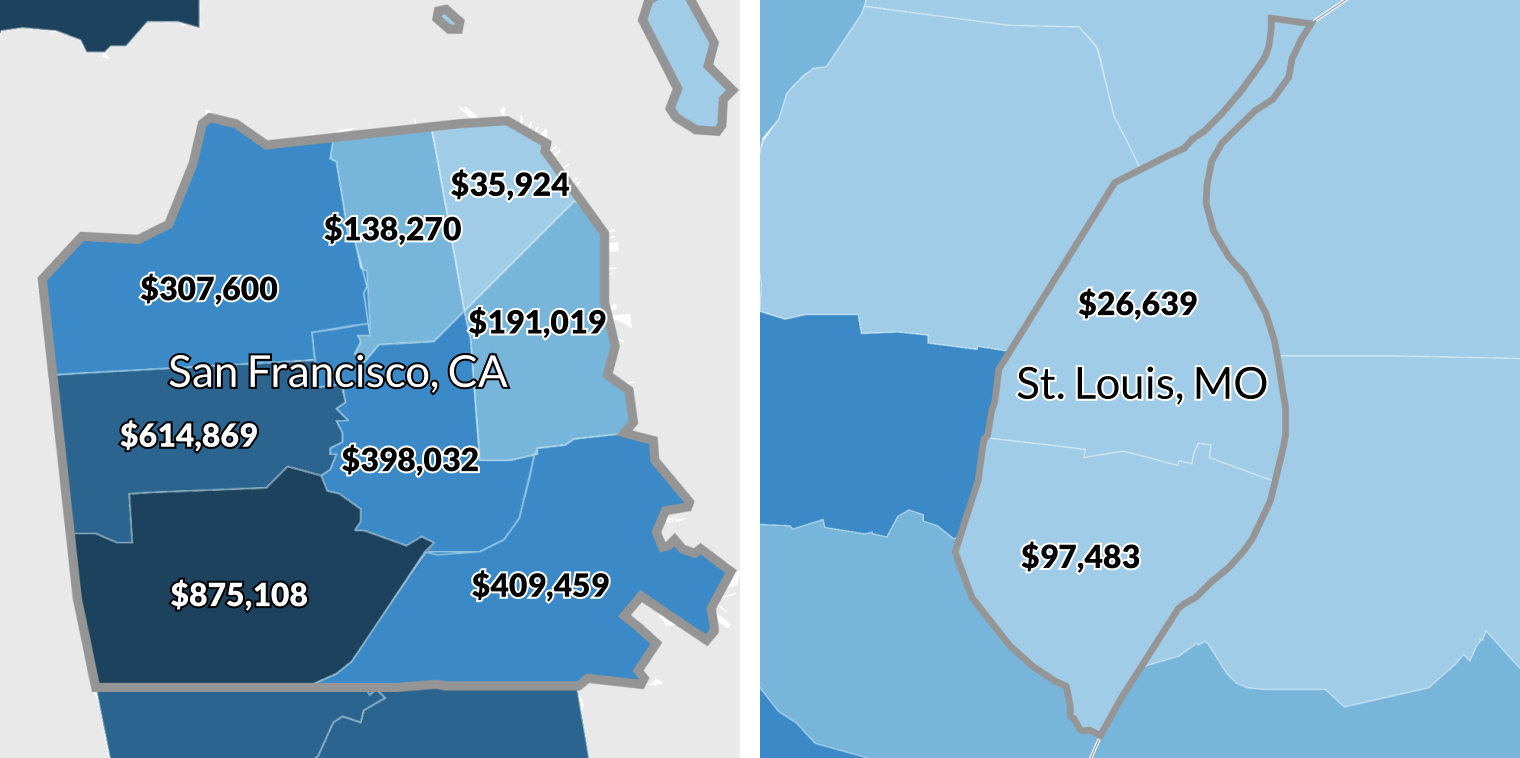
In north St. Louis, the 2022 median net worth was roughly $27,000, just more than one-quarter of the net worth in south St. Louis (about $97,000). The disparity in wealth between San Francisco’s local areas was even greater: Residents in the southwest portion of the city, Ingleside and South Central, had a median net worth of roughly $875,000, 24 times that of residents living in China Town, North Beach, and Russian Hill (about $36,000).
Median net worth in St. Louis and San Francisco, 2022
To support access to wealth-building opportunities, local leaders can remove barriers and promote asset development at the individual and community levels. Building on the success of matched-savings programs, early life wealth-building programs such as baby bonds and child savings accounts hold promise as an investment in young people. Invest STL’s Rooted: Cultivating Black Wealth in Place program, in the West End and Visitation Park neighborhoods, and San Francisco’s Kindergarten to College program are both examples of local wealth-building programs.
Putting the data to work
By using the Financial Health and Wealth Dashboard, city and community leaders from government, philanthropy, and practice can better understand the reality of their community’s financial health. With this information, these leaders can improve their budget planning, grant targeting, and program evaluation.
The dashboard also includes detailed, evidence-based strategies that can inform efficient and effective policies that allow local leaders to support struggling residents. After all, financial well-being isn’t just about data, it’s the lives, neighborhoods, and futures of the people those data represent.
Let’s help communities build more secure, hopeful futures.
Today’s complex challenges demand smarter solutions. Urban brings decades of expertise to understanding the forces shaping people’s lives and the systems that support them. With rigorous analysis and hands-on guidance, we help leaders across the country design, test, and scale solutions that build pathways for greater opportunity.
Your support makes this possible.